Collected the observations
Captured a time series around the predicted transit window with the York University 1-metre telescope.
PHYS 3070 course project · York University
I captured an exoplanet transit with York University’s 1-metre telescope and wrote the Python processing pipeline used to turn the raw FITS frames into a light curve.
Project overview
I completed this as my course project for PHYS 3070, Planets and Planetary Systems, a third-year York University course. I observed the transit with the Allan I. Carswell Observatory’s 1-metre Cassegrain telescope and wrote the reduction in Python.
I now TA PHYS 3070 and deliver lectures on exoplanet transits, observational methods, and Python-based transit analysis. The notebook below is the complete course project, with the raw observation data included.
What I did
Captured a time series around the predicted transit window with the York University 1-metre telescope.
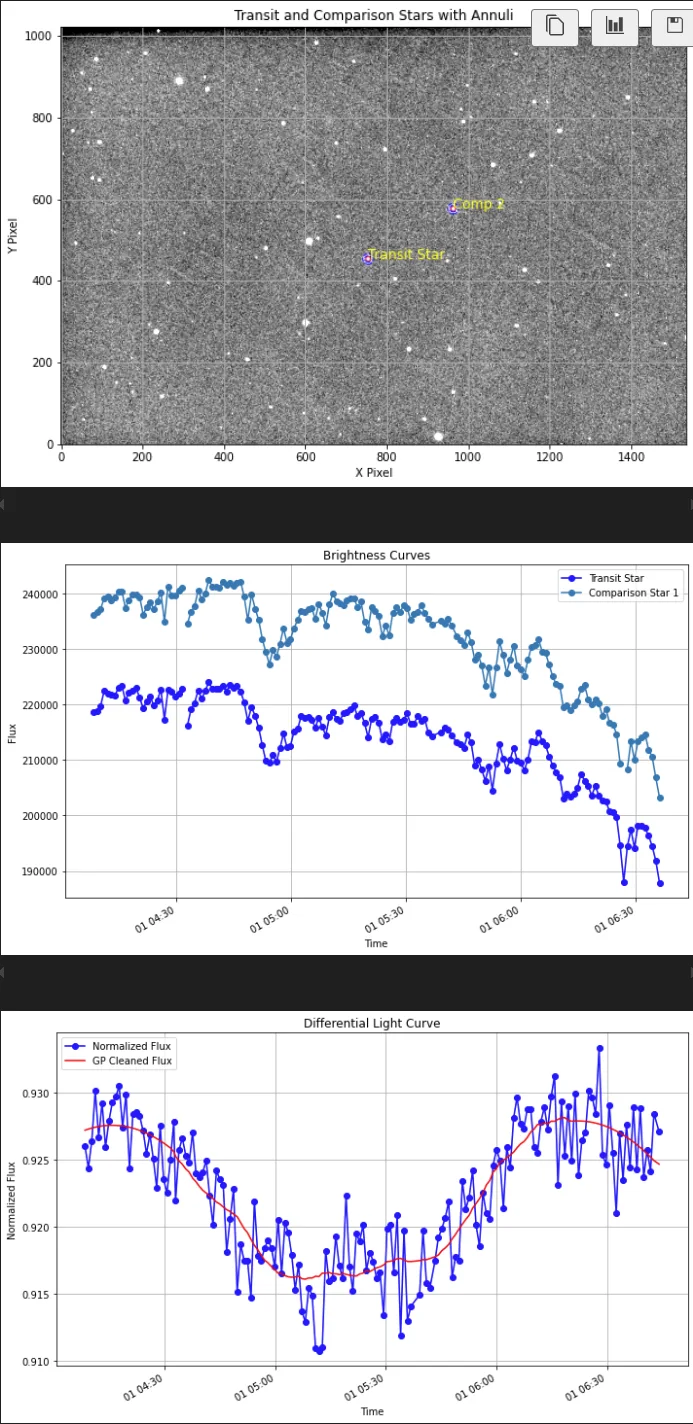
Calibrated the FITS frames, measured stellar flux with aperture photometry, and normalized the target using comparison stars.
Processed the full observation sequence and documented the analysis in an executable Jupyter notebook.
Processing steps
Correct detector and background effects before measuring any stellar flux.
Use consistent apertures and background estimates for the target and comparison stars.
Normalize the target against stable field stars to reduce atmospheric and instrumental variation.
Build the time series and inspect the transit shape and scatter.
Complete project
The embedded notebook contains the processing code, intermediate steps, plots, and final light curve. The raw observation data are linked beside it.
Course and teaching context
This started as my third-year course project. I now return to the same course as a teaching assistant and deliver lectures on exoplanet transits, observational methods, and Python transit analysis.
The full notebook and raw observation data are available above.